|
The Innes family From Sydney transitioned to an EV a year ago. Their vehicle of choice was a Hyundai Ioniq 5. It's their go-to car for local errands, but they've also used it for several road trips, even carrying four bikes! They have covered 9,180 kilometres so far. They have a 15-kw solar system and also a retail plan that offers free access to the grid during the middle of the day on weekends. Mr. Innes is keeping close track of all their charging costs to see how much money they're saving with the EV. 
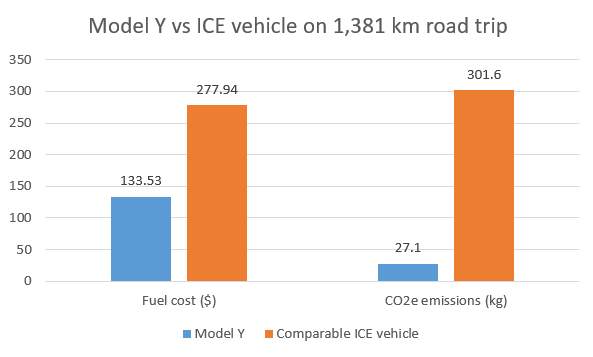
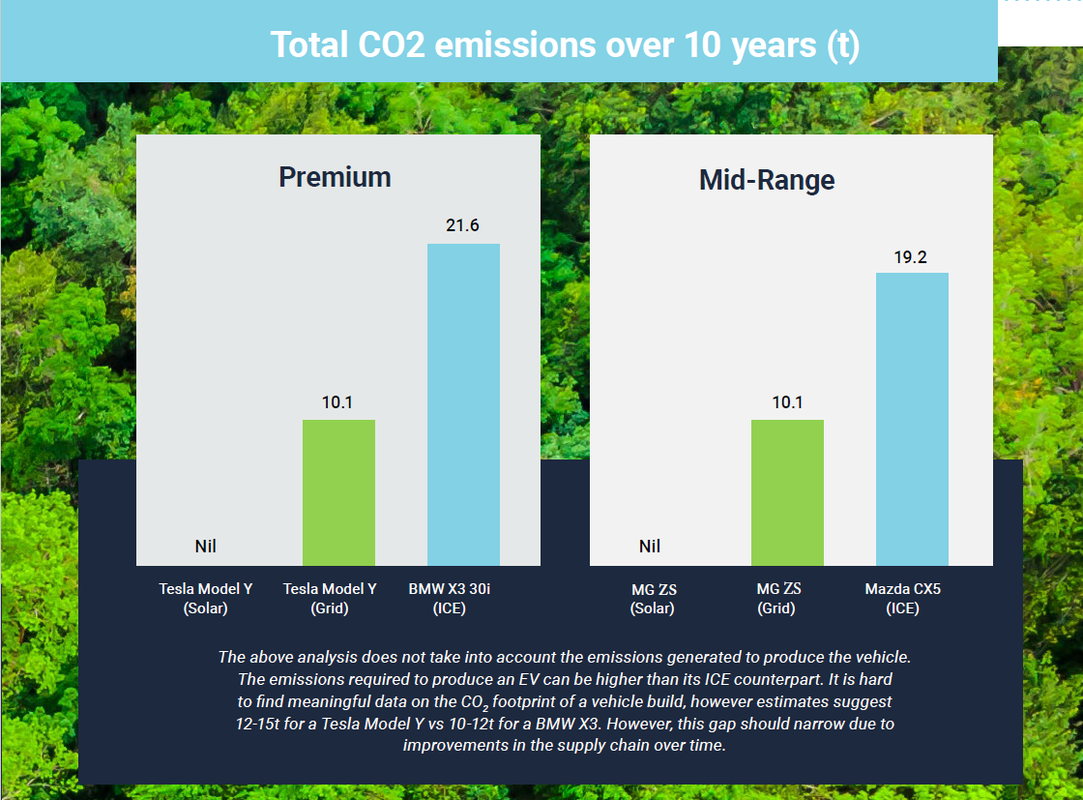
Source of power The below chart details the sources of all power used to charge the vehicle. The vast majority, over 80%, has come from charging at home.  Cost of power However, while charging at home accounts for 80% of the power used it only accounts for 30% of the total costs spent. This is primarily due to taking advantage of excess solar energy and free grid charging on weekends. Supercharging, while only accounting for 12% of power consumed, accounts for 70% of the total costs incurred!  Comparison to ICE vehicle So how does this compare to the Innes family’s previous Internal Combustion Engine (ICE) vehicle?  The ICE vehicle would have cost over $2,000 in fuel compared to the $192 for the EV, a staggering 12.1x uplift. However, when the cost and kilometres associated with supercharging are excluded, this difference between the EV and the ICE vehicle increases to a 42.2x difference!  The above analysis does not take into account maintenance and servicing costs which would increase the cost gap between the EV and ICE vehicle even further. EV’s have around 20 moving parts compared to over 2,000 for a petrol vehicle resulting in far lower service and maintenance costs. Final word The average passenger vehicle in Australia travels just 33.2 km per day meaning the vast majority of charging could conveniently happen at home. So the experience of the Innes family is likely to be one that could replicated by many households around the country, even those without solar who can now take advantage of retail plans offering free access to the grid for charging during certain times of the day. ICE vehicle calculation based on the average unleaded fuel price in Sydney as per the NRMA website on 18 June 2024 and a fuel efficiency of 12L per 100km. The fuel efficiency is based on the vast majority of kilometres being driven on short runs in a hilly area which is where the person subject to this analysis resides. Australian households 🏠 are paying an average of approx. 35 cents per kWh for their electricity, a record high and it continues to rise 💸 10-15 cents of this cost relates solely to the use of the "poles & wires" to transport the electricity from where it is generated to your home; that's the cost a homeowner has to pay BEFORE factoring the cost of the electricity. Now what is someone told you that you could lock in a price of just 5 cents per kWh for the next 20 years?! Well you can do just that with a solar and battery system 😎 🔋 
Solar and battery cost is based on actual data from My Energy Guide Founder’s household and assuming a 20 year life with $1,500 p.a. income from exporting excess energy. It excludes any financing costs. The solar and battery cost is for illustrative purposes only and it could materially differ depending on the household’s hardware, location and energy and travel demands. 
When you use power matters.
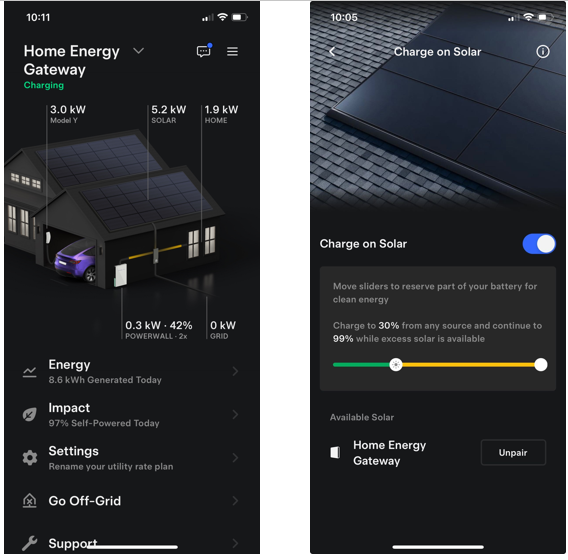
If you use power from the grid in NSW outside of 9am to 3pm then, no matter what claims your retailer may make about carbon neutrality, it is predominantly power generated from coal which has a high carbon footprint. If you have a solar system without battery storage then chances are you still use a significant amount of power from the grid outside of the hours of 9am to 3pm, and therefore you are generating a significant amount of CO2 emissions. You may generate excess solar over and above what your home uses that you claim as an “offset” against power drawn from the grid. However, this may not always be the case as there are instances where rooftop solar is displacing large scale solar and wind as opposed to fossil fuels. The QLD, VIC and WA grids largely mimic NSW, while SA and TAS have a cleaner profile with higher amounts of renewable energy through the daily cycle. Enter the home battery Home battery storage lets you capture excess energy from your solar system, or charge from the grid when the grid is clean and cheap. This green, cheap energy is then used to power your home through the evening peak when the grid has it’s highest CO2 emissions and highest prices. If you have excess energy in your home battery then some retailers also let you export this to the grid to the evening peak to maximise your income or minimise your power bill. The NSW Government has launched a new rebate program to make installing a home battery even more affordable. This is a fantastic opportunity to boost your energy independence, save on bills, and contribute to a cleaner energy future. 
Here's the rundown on the NSW Home Battery Rebate:
Why should you consider a home battery? Home batteries allow you to store excess solar energy generated during the day and use it at night or during peak demand periods. This can significantly reduce your reliance on the grid and bring down your electricity bills. Additionally, batteries provide backup power in case of outages, keeping your lights and essential appliances on. Taking advantage of the rebate The rebate will be accessible through approved suppliers who will be accredited in the coming months. Keep an eye out on the NSW Government website for updates on accredited suppliers. Word of caution While the NSW Government's home battery rebate starts in November, there's an opportunity to get a good deal right now. Due to the five-month delay between the policy announcement and implementation, demand for batteries is currently low, meaning steeper discounts might be available. However, with a surge in demand expected come November, there's a chance of installation delays and price increases due to limited workers and materials. This could mean the full rebate amount might not translate directly to savings for you. So, if you're considering a home battery don't wait. You could potentially save more by shopping around now and enjoying immediate energy bill savings for the next six months. My Energy Guide is excited to announce the launch of our Hot Water 101 Guide. This comprehensive guide is packed with valuable information to help you save energy and money at home. Download your free copy today and unlock a more sustainable future! 
Charged up and ready to role. So how do you fuel your EV dream financially? Click here to explore the different financing options to get you on your journey to low cost, low emission motoring. 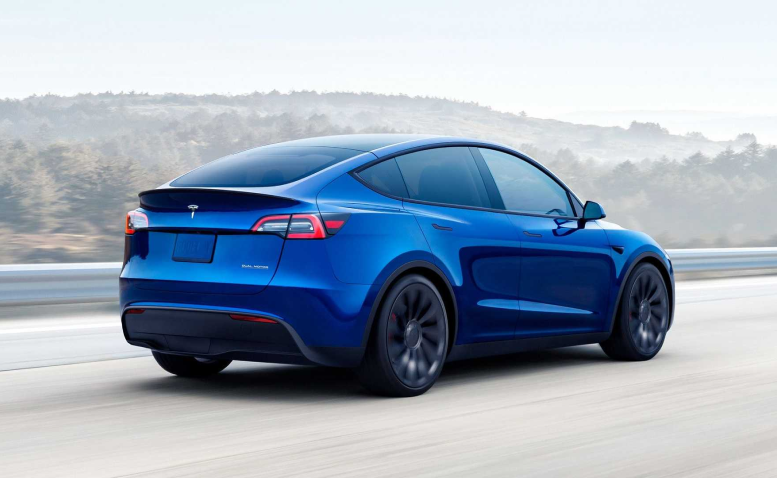
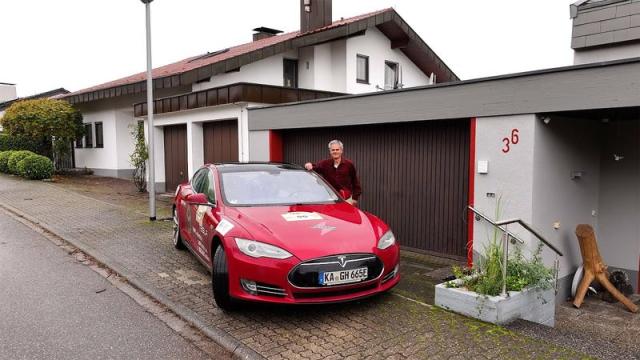
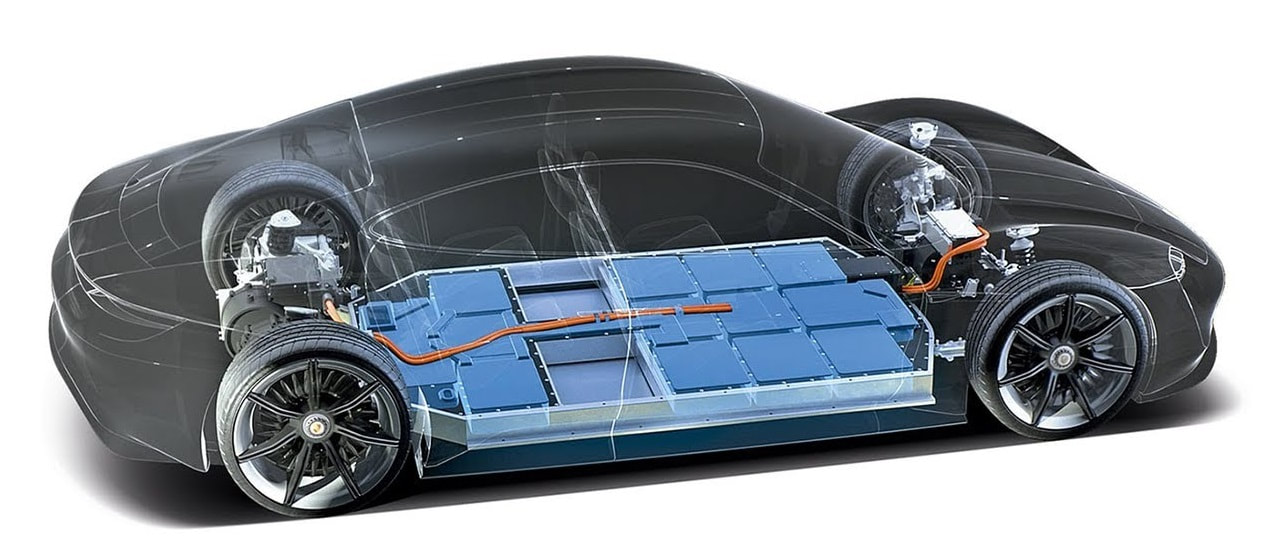
One of the biggest myths surrounding EVs is that their battery packs will need frequent replacement. This is simply not true!! At the recent Everything Electric expo in Sydney, Robert Llewellyn caught up with Nigel Raynard of Byron Bay Luxury Tesla. Nigel has driven over 700,000 kilometres in his 2017 Tesla Model S.
The average Australian motorist covers 12,000 km per annum, which at this rate would give them a whopping 55 years’ worth of battery life!! The much-anticipated Tesla Powerwall 3 has just been released in the US. The Powerwall 3 is the latest version of Tesla’s home battery system. This sleek, powerful battery system lets you store solar energy, gain independence from the power grid, and even provide power to your home during outages. What are the key similarities and differences to the Powerwall 2? Power storage and power output Both the Powerwall 2 and Powerwall 3 have 13.5 kWh of storage capacity. However, the power output of the Powerwall 3 is improved significantly increasing from 5 kW to 11.5 kW. While big loads will soon drain the battery, this does however mean you will avoid hitting the grid if you run multiple appliances concurrently e.g. the kettle, toaster and oven. Charging of the Powerwall 3 is limited to 5 kW like the Powerwall 2. In-built solar inverter Perhaps the biggest game changer with the Powerwall 3 is the integrated solar inverter allowing solar to be connected directly for high efficiency. The in-built inverter is rated at 11 kW meaning it can convert up to 11.5 kW of solar energy from your panels into usable electricity for your home. As the battery can also charge at 5 kW, the system has a total capacity of 16.5 kW. Under the Clean Energy Council rules in Australia, which state that panel capacity cannot exceed inverter capacity by more than 33%, the Powerwall 3 could potentially support up to 20 kW of solar panel capacity without the need to purchase a separate inverter. Price The Powerwall 3 is not yet available in Australia, however in the US it is priced similar to the Powerwall 2. This in effect represents a significant value add for the consumer given the built in inverter which could save thousands of dollars on the cost of an overall system. Compatibility Be aware, Tesla Powerwall 3 is not compatible with the Powerwall 2. As at the date of this article, Tesla has made no announcement to phase out the Powerwall 2. But if you are a Powerwall 2 owner and want to add more capacity then you should monitor any such announcements closely. 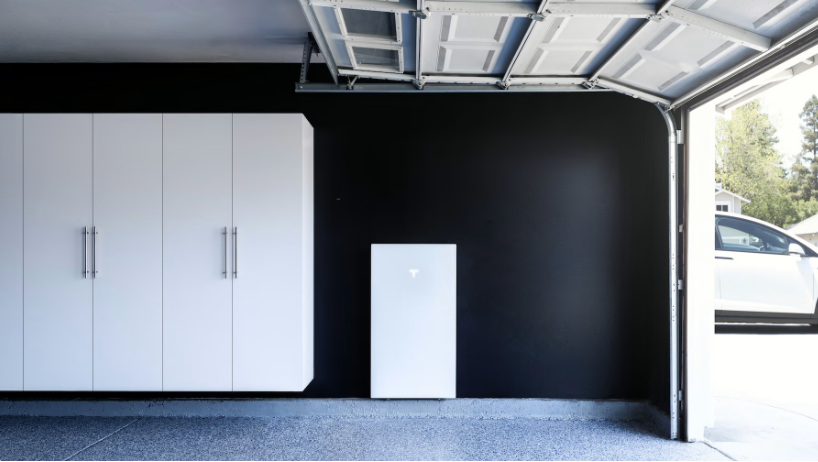
Imagine going on a road trip and before your return journey you stop to fill up with petrol. Now instead of paying $2 per litre someone pays you for the petrol you put in your car, and this petrol burns clean emitting no carbon dioxide or carcinogenic compounds. That’s the power of an EV combined with solar and Amber Electric. After arriving at a hotel I plugged my car in to charge at an Exploren charger, costing $0.33 per kWh. At the same time my solar and battery system is exporting power at an average rate of $0.46 per kWh. I set my car to charge at the same rate that my solar/battery exports; so green electrons are going into the grid at the same rate and same time that I am taking them out. So I’m in effect being paid to charge my car and the energy being used for driving is still 100% renewable. Even on a road trip you can still achieve no cost and 100% renewable driving 🙌 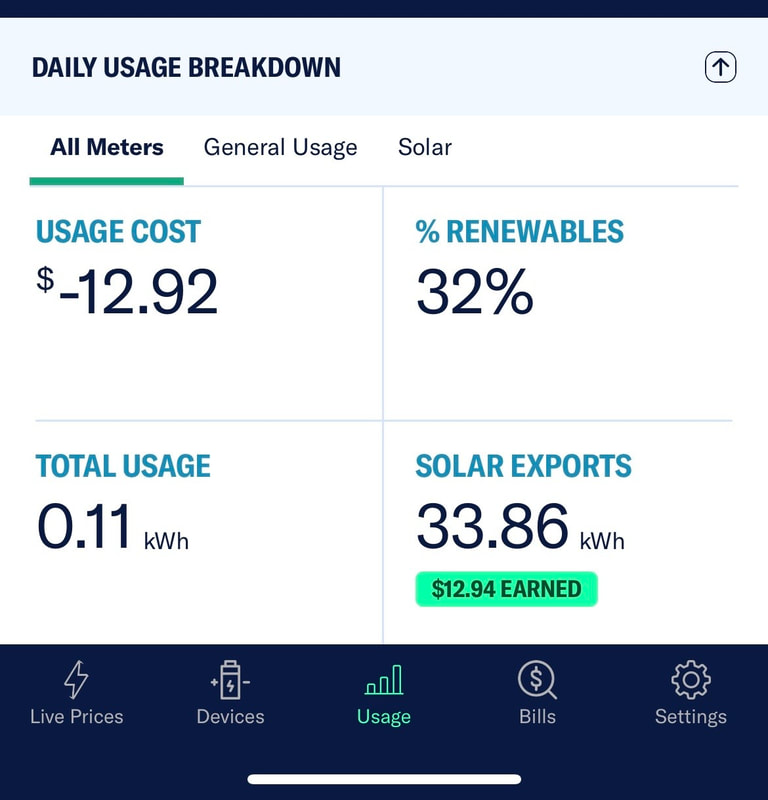
🚘 Congratulations on joining the EV Revolution! Here are some top tips to help you smoothly transition to your new vehicle: 
Battery life
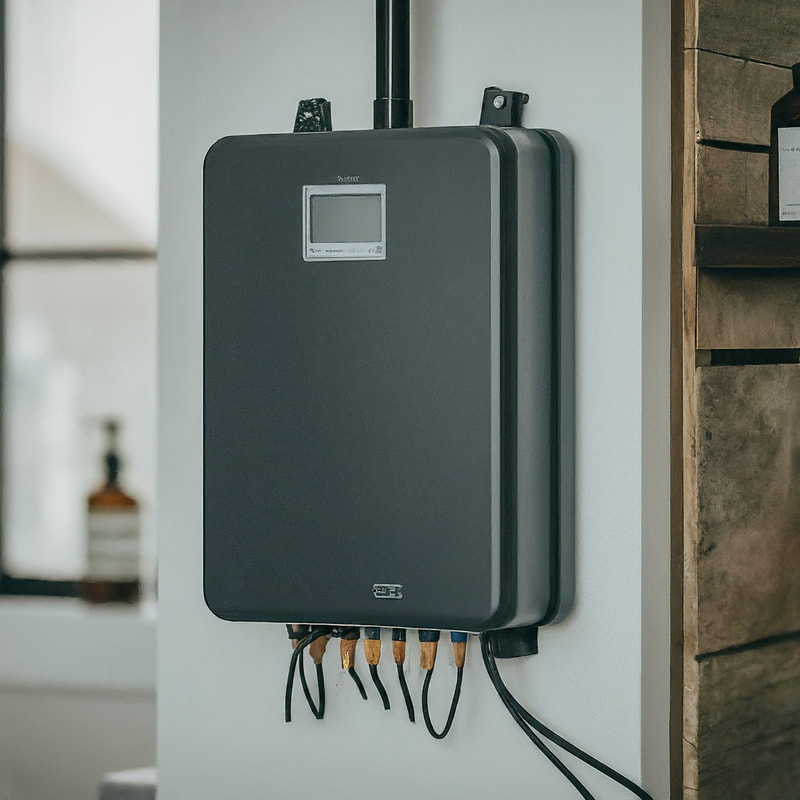
This blog will give you an overview of the key ways to charge to your EV, ranging from a standard 10-amp 240V wall socket to a state-of-the-art supercharger. Let’s first start off by addressing the elephant in the room – “range anxiety”. Electric vehicles have become synonymous with the term “range anxiety” – used to express a fear of not being able to reach your destination before running out of power. However, almost as soon as this phrase became commonplace, it had already become a myth – if it ever was true in the first place. The job of a solar inverter is to convert the direct current (‘DC’) from the solar panels into alternating current (‘AC’) used in your home and the grid (refer to the appendix for more detail on DC vs AC). The inverter also generally acts as the overall monitoring system for your solar giving you detailed statistics, through a mobile app, on how much power your solar system is generating, how much power your home is using and how much power is being sent to or drawn from the grid. |
AuthorWrite something about yourself. No need to be fancy, just an overview. Archives
June 2024
Categories |
|
Quick Links |
JOIN OUR MAILING LIST
|


 RSS Feed